Company News
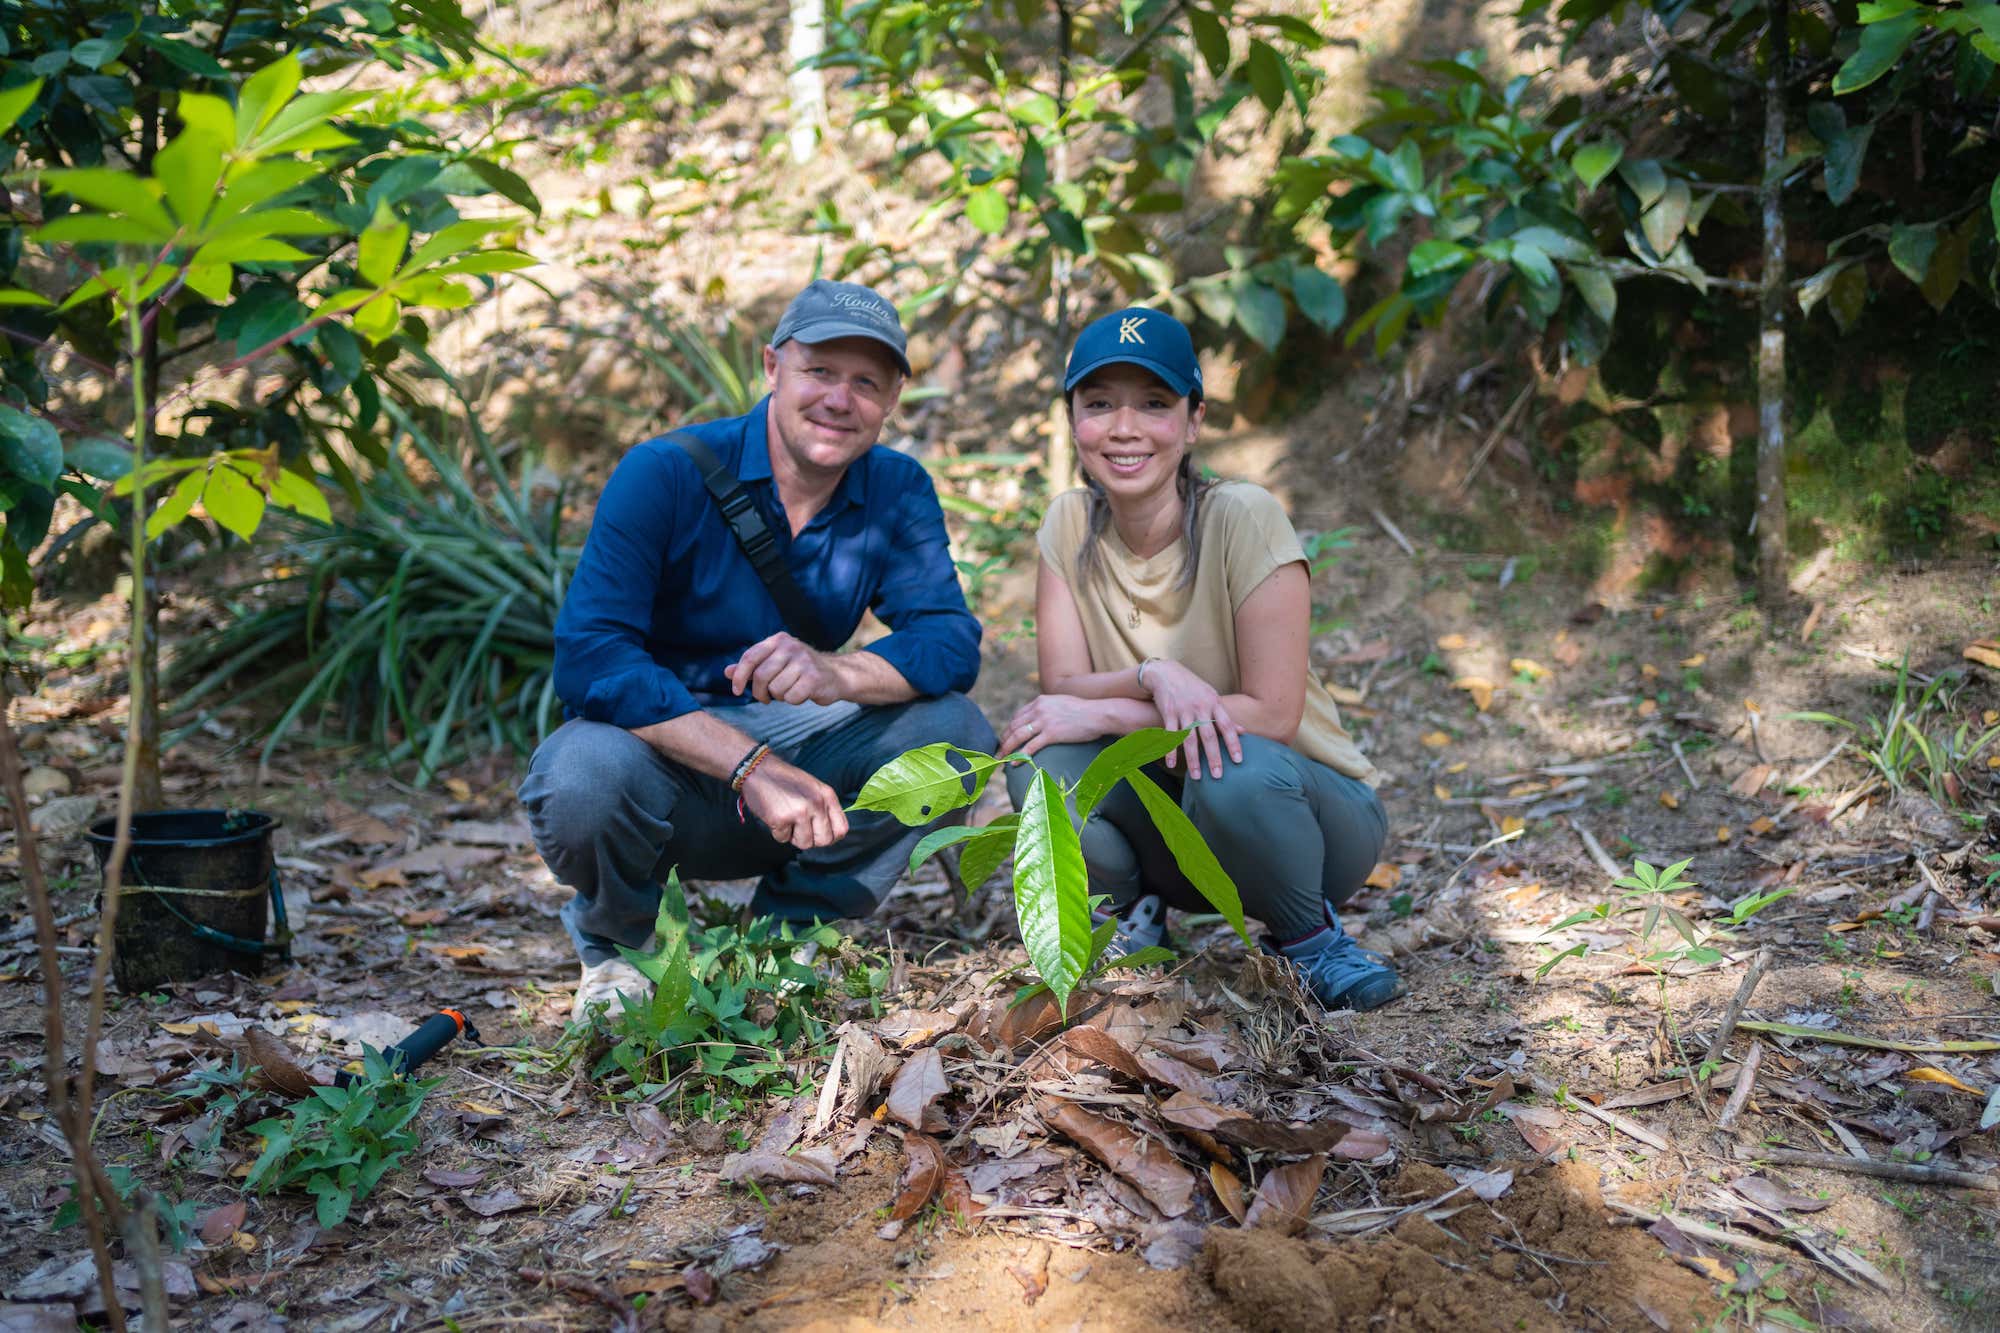
Slow Forest Coffee & Krakakoa Scale Regenerative Food
Denmark's Slow Forest Coffee and Indonesia's Krakakoa Chocolate have formed a strategic partnership to scale up nature-positive practices across the entire food chain. Beyond beans, we are rebuilding nature — soil, ecosystems, even farmers. Fueling this ambitious agenda is a $5M+ investment, providing crucial resources to accelerate innovations and reach a wider impact.
Our Impact
Your Consumption Can Be The Solution
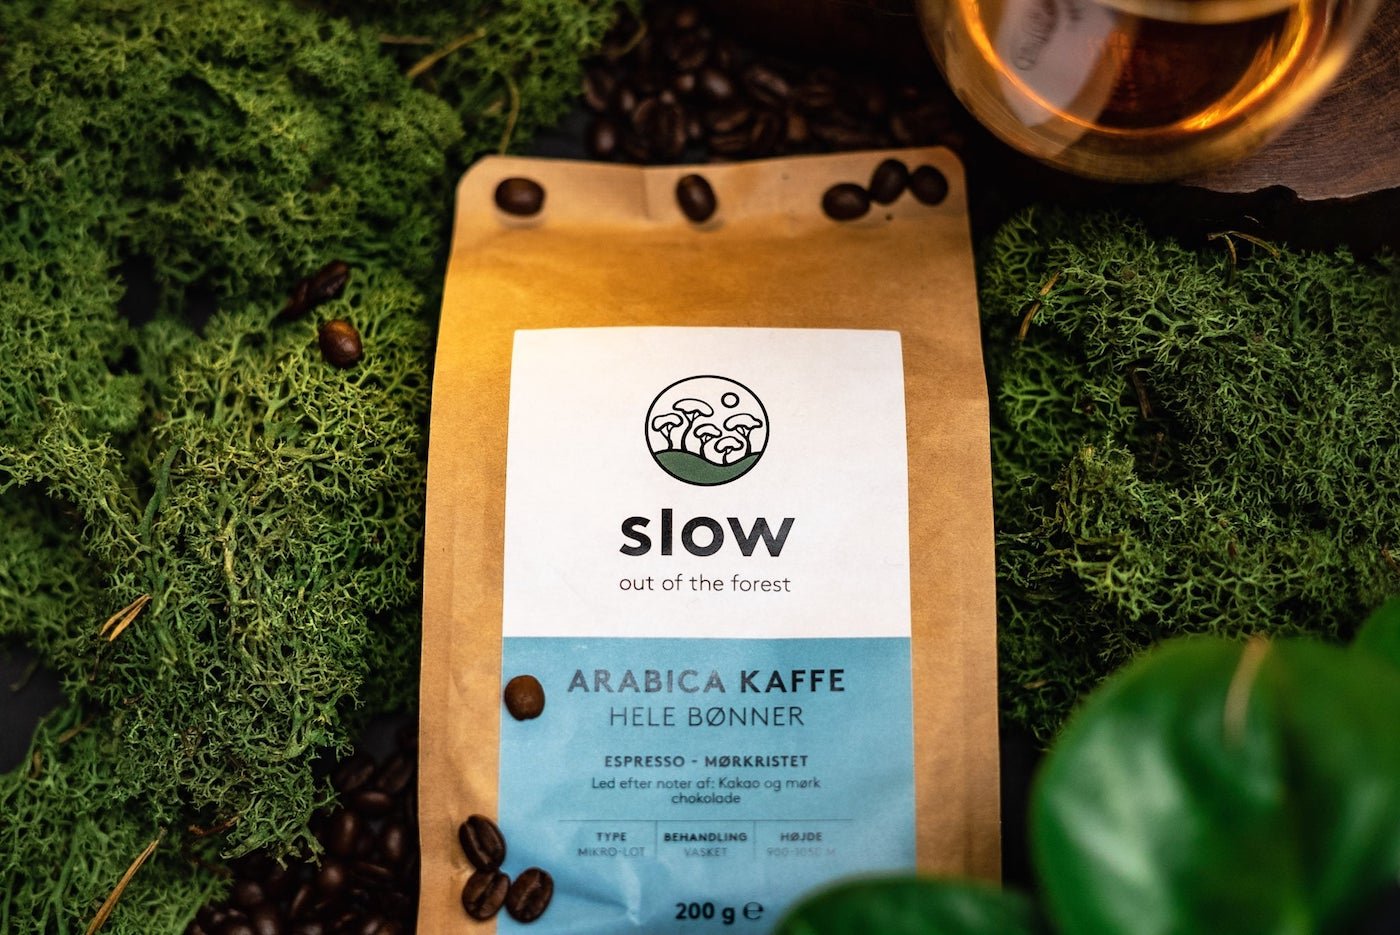
Making an impact is very important to us, just like the quality of the coffee. We want to offer our customers the best specialty coffee, for a fair and honest price. By drinking one cup of coffee you immediately make an impact. You're making the coffee market more transparent, fairer and more sustainable.
SBTi
Slow is Carbon Negative
At Slow, we are committed to building a more sustainable food system. That's why we are proud to be carbon negative today and net zero by 2030. We are reducing our absolute emissions by 90% across Scope 1, 2, 3, and FLAG by 2030, consistent with a science-based target approved by the Science Based Targets initiative. We are also investing in agroforestry, a major carbon sink that absorbs carbon dioxide from the atmosphere to help mitigate climate change.
%20logo.jpg)
Articles
Coffee Monoculture Poisoning The Planet and Your Cup
Do we want monoculture? Dr Athina Koutouleas exposes the harmful impacts on both human health and farming ecosystems. Read why alternatives like agroforestry are crucial.
-Slow%20Forest.jpg)
Partnership with WWF
Together for Prosperous Forests
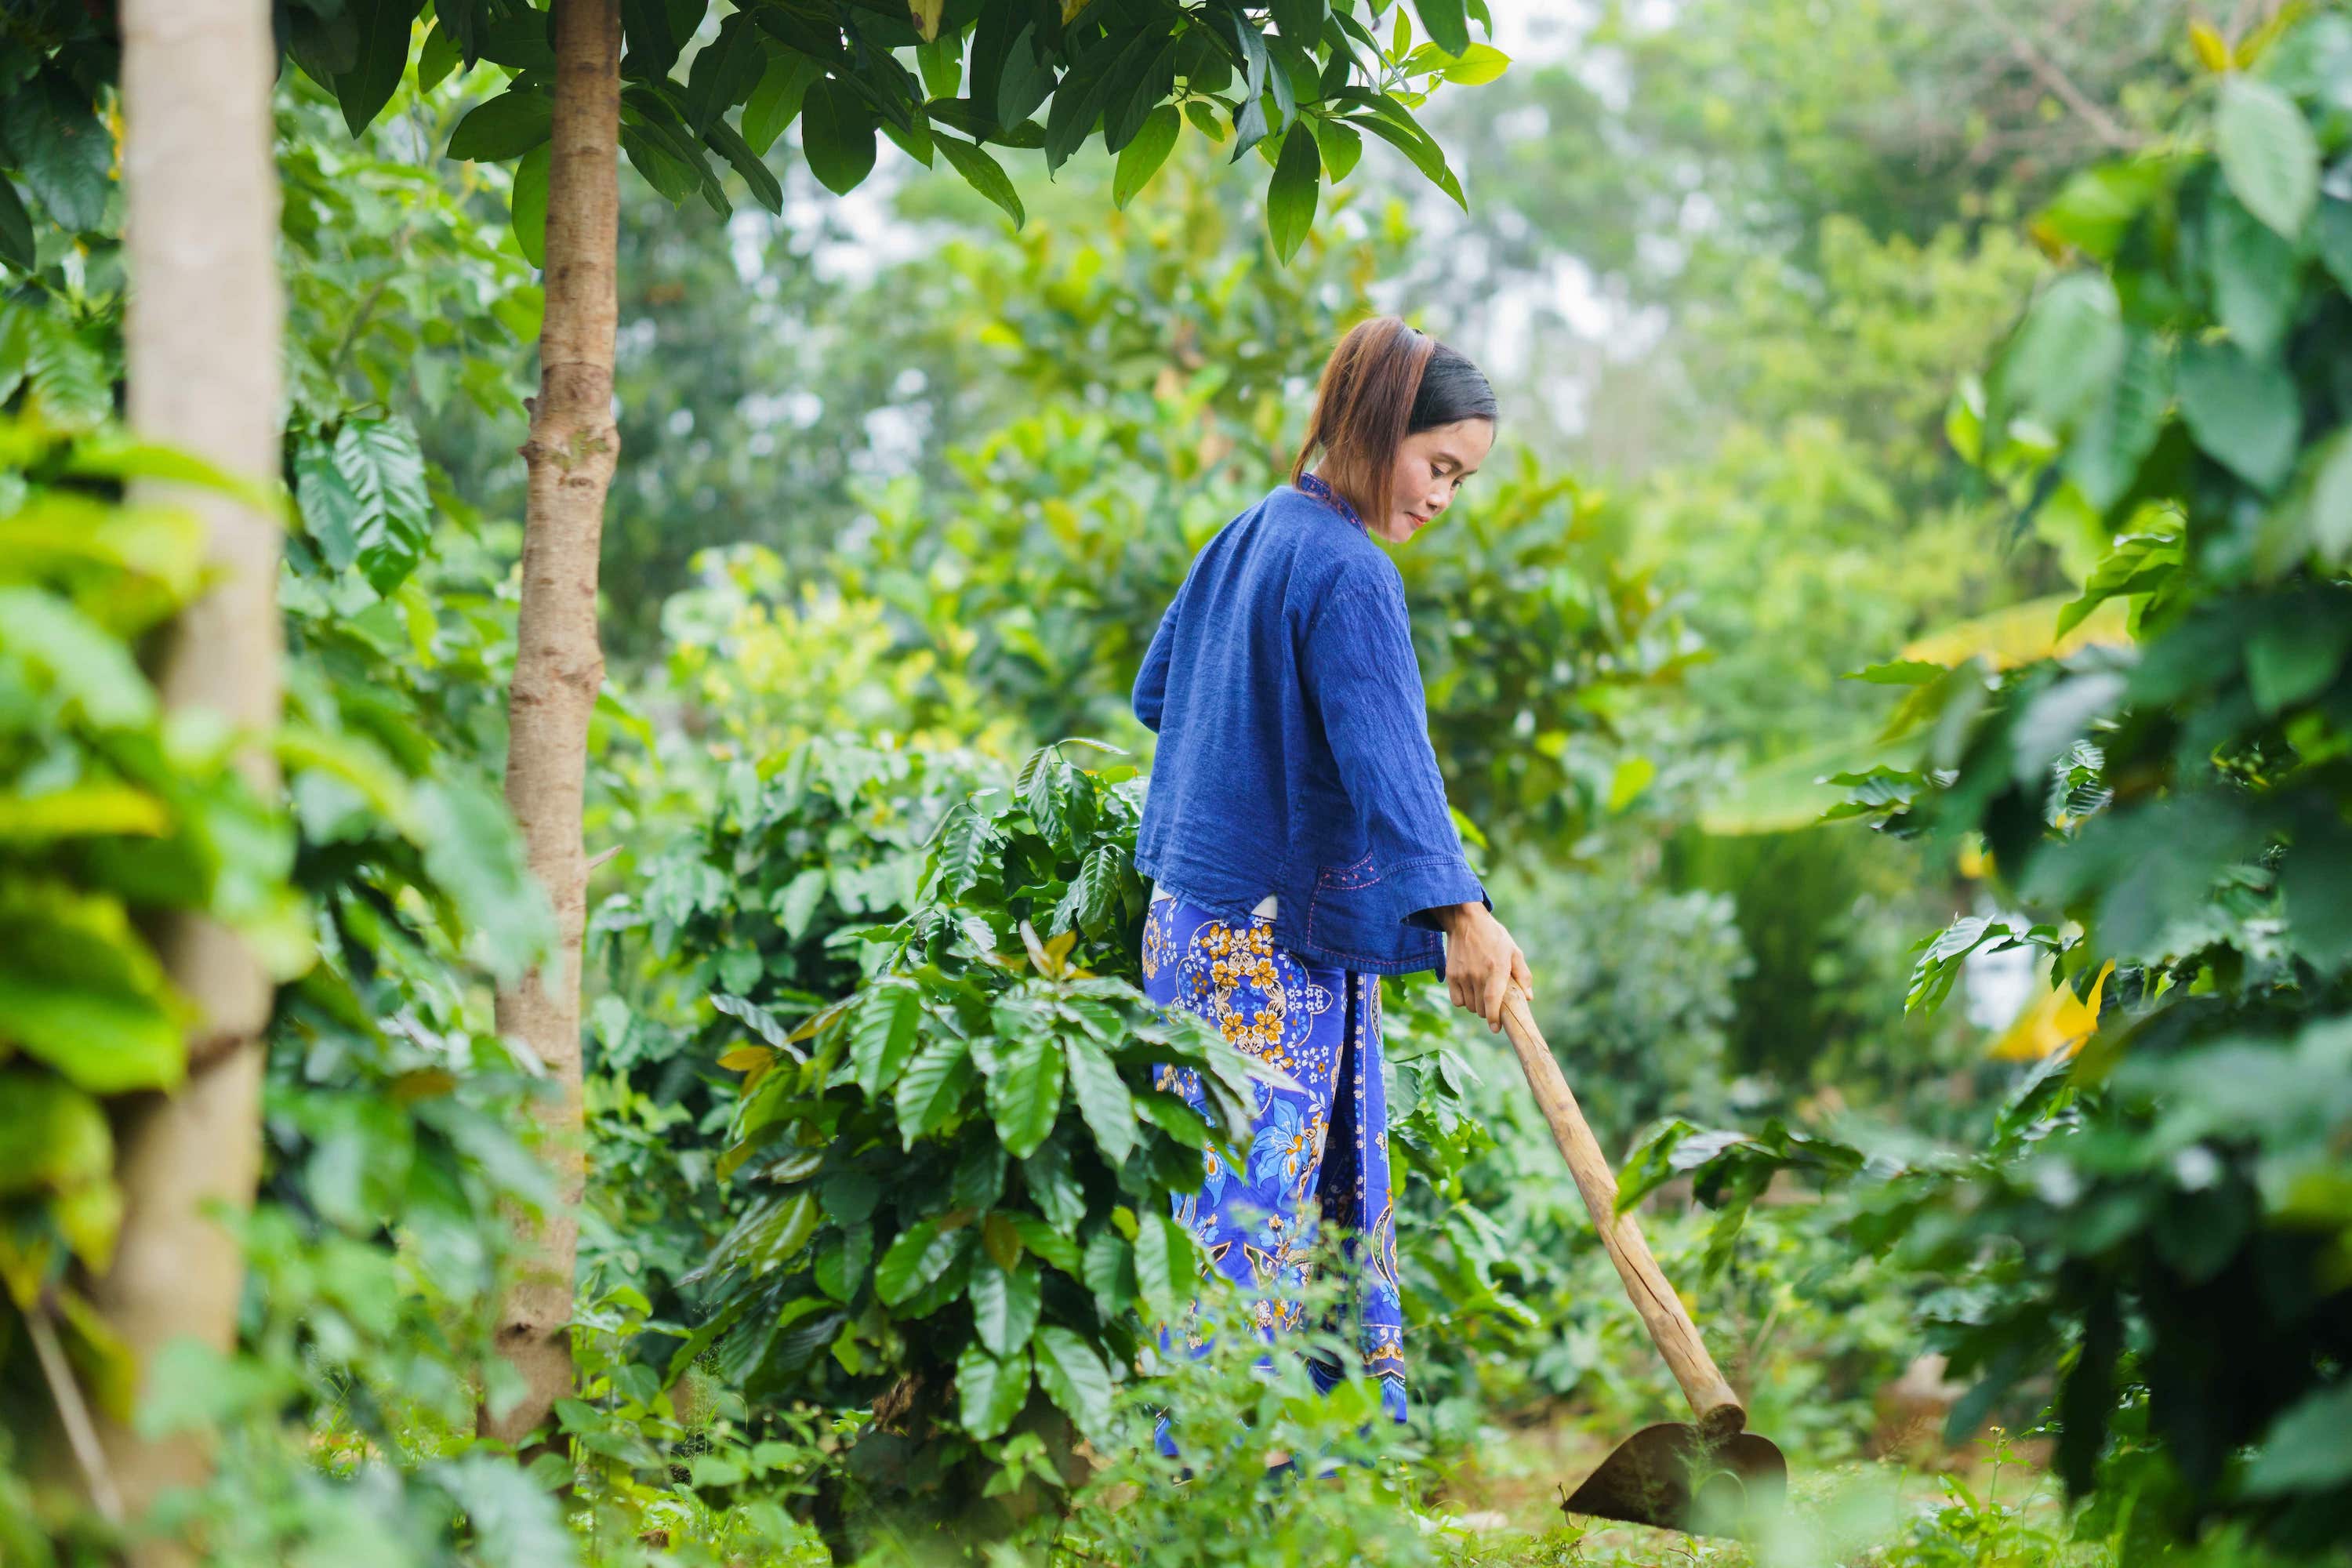
WWF and Slow are working together to develop a production-protection model by introducing regenerative agroforestry practices in the buffer zones of WWF priority conservation areas, including Quang Tri province in Vietnam. Together, we create a new way to produce coffee, one that is sustainable, transparent, economically attractive and good for the people and the planet.


"Slow has thought through the entire value chain and the ESG agenda into their product. It really speaks to us. We want to be part of that journey. Because when we help them, they also help us on the big ESG agenda."
Andreas Sørensen
Head of Maersk Facility Management Denmark
Coffee Tasting
Book A Free Coffee Tasting
Slow is roasted by Michael De Renouard, a leading Nordic specialty coffee expert. Our coffee is sustainably sourced and roasted to perfection, and we offer a variety of flavors. Choose from our pre-designed flavors or let us develop a custom flavor for your business.

Delicious Coffee, Every Time
Taste our sustainable specialty coffee, crafted to elevate your game

Real Impacts
Sourced directly, roasted perfectly, made with care

Storytelling
Take a deeper dive into the coffee chain and stories from farmers in producing countries

Easy Switch
Sustainable coffee made easy for businesses that care

ESG Reporting and Data
Measure and track your progress towards sustainability goals

Multi-Stakeholders Approach
Slow empowers everyone, from C-levels to frontliners, to contribute to sustainability